Usage
ipydatatable is a jupyter widgets library based on ipywidgets and build using the widget-cookiecutter. The great thing about the library is that you can easily interact with a visualization and pass data from Python to the visualization and back. The package utilizes the jQuery DataTables library to convert the Pandas DataFrame into an interactive table.
Lets look at an example of how to use the library.
import ipydatatable

# imports below only required for example
import numpy as np
import pandas as pd

df = pd.DataFrame(np.random.randint(0,100,size=(100, 4)), columns=list('ABCD'))
table = ipydatatable.InteractiveTable(table=df)
table
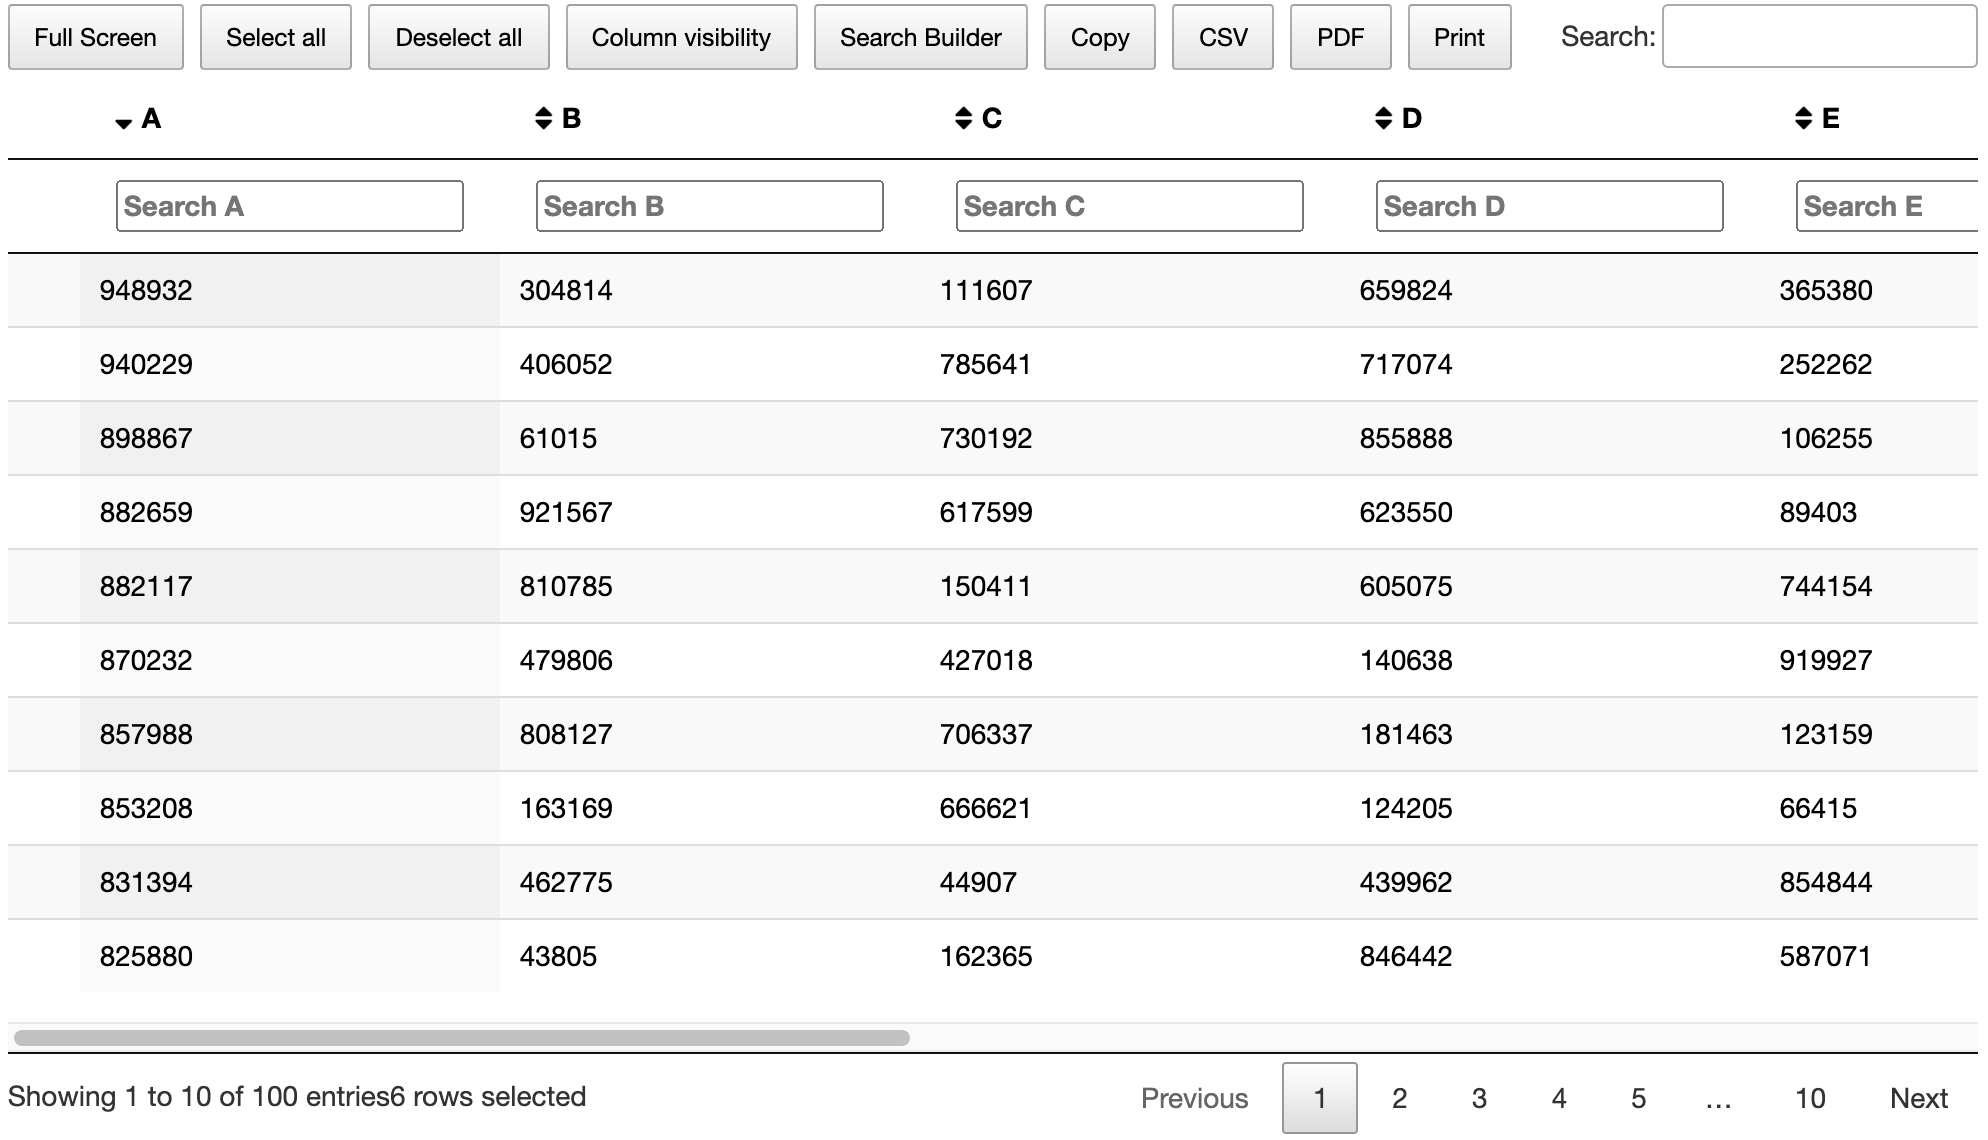
Once you run this you will get an interactive table that looks like the image above. This table can filter data, hide columns, select rows, have child rows and more!
Interactive Table
In usage you saw how to simply display a table with data as parameter but the function takes more values than just table data.
ipydatatable.InteractiveTable(table, column_filter, text_limit, sort_column, columns, init_state, selected_data, selected_index_row, selected_group, child_group_select)
Attributes
- table: Data to be passed to the table. his can be in 3 formats but we encourage the usage of Pandas DataFrame.
- Pandas DataFrame - The encouraged format for its data validating features.
- Dictionary - Format of {“col1”:[row1, row2]}
- List - Format of [{“col1”:row1},{“col1”:row2}]
- column_filter: When set to true, this allows the user to show a search box per column. Default to True.
- text_limit: Limit for the amount of characters to display per cell in the table. Defaults to 1000.
- sort_column: Column name to initialize the sorting of the table. Defaults to desc order the first column.
- columns: List containing the names of the columns to hide/show at initialization. Default to empty list.
- init_state: String to determine if the columns list should be used to hide or show the columns. Takes value of show to show the columns in the list or hide to hide said columns. Defaulted to hide because of the empty list.
- selected_data: Contains data from selected rows in the table.
- child_group_select: Boolean value that allows the group column to be converted to selectable buttons on the child dropdown.
- selected_group: List that you can pass the values of the selected groups buttons to be initialize. It has to be passed as the following format “row_index:key:value”.
Table
This is the most important parameter since it contains the data to be displayed. It can be initialized in 3 ways but it is encourage to use a Pandas DataFrame as the format. We will show all three with examples below.
Pandas DataFrame
DataFrame is a 2-dimensional labeled data structure with columns of potentially different types. You can think of it like a spreadsheet or SQL table, or a dict of Series objects. It is generally the most commonly used pandas object. For more information you can click here. Lets look at an example
# Last Dict in the list is missing column B so that will be filled with a null.
lt = [
  {"A":1,"B":1,"C":4},
  {"A":1,"B":1,"C":4},
  {"A":1,"C":4},
]
df = pd.DataFrame(lt)
# uncomment the following if you want to fill the null values
# df["B"] = df["B"].fillna("This is empty")
table = ipydatatable.InteractiveTable(table=df)
table
Column Filter
The table has a general table filter, meaning you can search for something on all the columns at once. If you would like to filter a column at a time, you can set column_filter to True and you will have a search bar for each column.
In the below example we will set column_filter to False in order to see the differences between having and not having the filter boxes.
df = pd.DataFrame({"A":[1,2,3,4,5],"B":[6,7,8,9,10],"C":[1,2,3,4,5],"D":[6,7,8,9,10]})
table = ipydatatable.InteractiveTable(table=df, column_filter=False)
table
Text Limit
This parameter will limit the amount of characters can appear per cell. This means that if you have something that is longer than text_limit it will be truncated. If you wish to view the rest of the value, on the first column you will find a + that when press opens a “child” row containing the full value that was truncated. The drawback to this feature is that if you are searching the table, either by single column or general search, it will only look at the data from the column until that truncation.
df = pd.DataFrame({"A":["This is a little more",2,3,4,5],"B":[6,7,"This is more than 10 characters",9,10],"C":[1,2,3,4,5],"D":[6,7,8,9,10]})

# default is 100 so we will look at only 10 characters per cell.
table = ipydatatable.InteractiveTable(table=df, text_limit=10)
table

Columns/init_state and Sort Column
Columns is used to hide/show columns from the beginning of display. Its an array of the columns that want to be displayed or hidden. In order to determine if the columns will be displayed or hidden, you can use the init_state parameter and set it to show or hide. The sort_column parameter allows you to sort on initial display. If nothing is set it will use the first column.
df = pd.DataFrame({"A":["This is a little more",2,3,4,5],"B":[6,7,"This is more than 10 characters",9,10],"C":[1,2,3,4,5],"D":[6,7,8,9,10]})

# When hidding you can still get the data back by selecting the columns from the dropdown "Columns" button on the top left.
table = ipydatatable.InteractiveTable(table=df, columns=["A","D"], init_state="show", sort_column="B")
table
DataTable Features
There are a couple of features to look at that may be useful to know of. The features are
- Row selection
- Buttons
- Full Screen
- Select/Deselect of Selected rows
- Column Visibility
- Search Builder
- Copy
- CSV
- Group Column
- Data update/observe
- Row selected
- Move Columns
Row Selection
When you click on a row in the table you are selecting that row. You can select multiple rows and then you can retrieve that data with the selected_data attribute. This will be updated every time a row is clicked.
lt = [
    {"A":1,"B":1,"C":4},
    {"A":1,"B":1,"C":4},
    {"A":1,"C":4},
]
df = pd.DataFrame(lt)
# uncomment the following if you want to fill the null values
# df["B"] = df["B"].fillna("This is empty")
table = ipydatatable.InteractiveTable(table=df)
table
Now select a row, try the last row that has no value on B and then run the following line
table.selected_data
out[]: [{'A': 1, 'B': None, 'C': 4}]
If you want to update the selected rows on the table you can update selected_index_row with an array of the index of the data. This will select the rows with those indexes.
Full Screen
This button allows the table to be put in full screen on the browser. You can see below how that looks.

Select/Deselect of Selected rows
This button allows the user to deselect all the rows or to select all the rows on the table.
Column Visibility
This button displays a dropdown that the user can use to hide or unhide columns. This works with the previous feature of initializing the hiden columns

Search Builder
This button will have a popup that allows you to perform a more specific query againt the table. Just like a multi column filter.

Exporting Data
There are 4 ways to export data from the datatable. The way that they work is by taking the data that is either filtered down or selected and using that to output. If nothing is selected or filtered it will take all the data to export. The options are copy, CSV file, PDF file and Print.
Group Column
If you have data that you would like to show the user but not in a column you can set it in the group column. The group column can take a dictionary and then display it in a child row. If text_limit is reached, it will also be shown in the child row with the group data. Below you can see an example of this feature.
lt = [
  {"A":1,"B":1,"C":4, "group": {"key1":"this is a child","key2":"is a child","key3":"a child","key4":"child"}},
  {"A":1,"B":1,"C":4},
  {"A":1,"B":2,"C":"This is just a tad long","group": {"key1":"this is a child with text_limit reached"}},
  {"A":1,"B":1,"C":4, "group": {"key1":"this is a child","key2":"is a child","key3":"a child","key4":"child"}},
  {"A":1,"B":1,"C":4},
  {"A":"Also a tad long","B":2,"C":"This is just a tad long","group": {"key1":"this is a child with text_limit reached"}},
]
table = ipydatatable.InteractiveTable(table=lt, text_limit=10)
table
Group Selection
Now if you would like to have a selection for child objects (make buttons of the values in the dictionary) there are two parameters. child_group_select makes the values of the group column dictionary into buttons while the selected_group can be used to initialize the values as selected already. They have to be in the format of row_index:key:value
lt = [
  {"A":1,"B":1,"C":4, "group": {"key1":"this is a child","key2":"is a child","key3":"a child","key4":"child"}},
  {"A":1,"B":1,"C":4},
  {"A":1,"B":2,"C":"This is just a tad long","group": {"key1":"this is a child with text_limit reached"}},
  {"A":1,"B":1,"C":4, "group": {"key1":"this is a child","key2":"is a child","key3":"a child","key4":"child"}},
  {"A":1,"B":1,"C":4},
  {"A":"Also a tad long","B":2,"C":"This is just a tad long","group": {"key1":"this is a child with text_limit reached"}},
]
table = ipydatatable.InteractiveTable(table=lt, text_limit=10, child_group_select=True, selected_group=['2:key1:this is a child with text_limit reached','5:key1:this is a child with text_limit reached'])
table

Once selected you can see the selected data in JSON format with a helper function, get_selected_groups.
table.get_selected_groups()

out[]: {'2': {'key1': 'this is a child with text_limit reached'},
      '5': {'key1': 'this is a child with text_limit reached'},
      '3': {'key2': 'is a child', 'key3': 'a child', 'key4': 'child'}}
You can also set the values to update selectors after the fact by chaning selected_group. Unforutnatley for now it has to be on the original format and not on JSON
table.selected_group = ['2:key1:this is a child with text_limit reached','5:key1:this is a child with text_limit reached']
Column hiding
We have seen this before, hiding column utilizing the dropdown on the top left. But what we haven’t seen is that we can extract the columns that have been hidden in case the user would like to come back to what they had before. From the previous code, hide a column and run the following.
hidden_columns = table.hide_columns
print(hidden_columns)
Data Updates
The Widgets are built on traitlets. This allows us to be able to observe any changes that occur from Javascript to the Python variable. This is useful for two attributes of the library, hide_columns and selected_data. The following code shows how to check if a value is updated on Javascript.
# Observe functions is looking for what the data change was.
def selected_function(change):
  print("old (rows): "+str(change['old']))
  print("new (rows): "+str(change['new']))

table.observe(selected_function, names=['selected_data'])